
AIOps & Automation · August 25, 2026
RCA moves from dashboards to evidence graphs
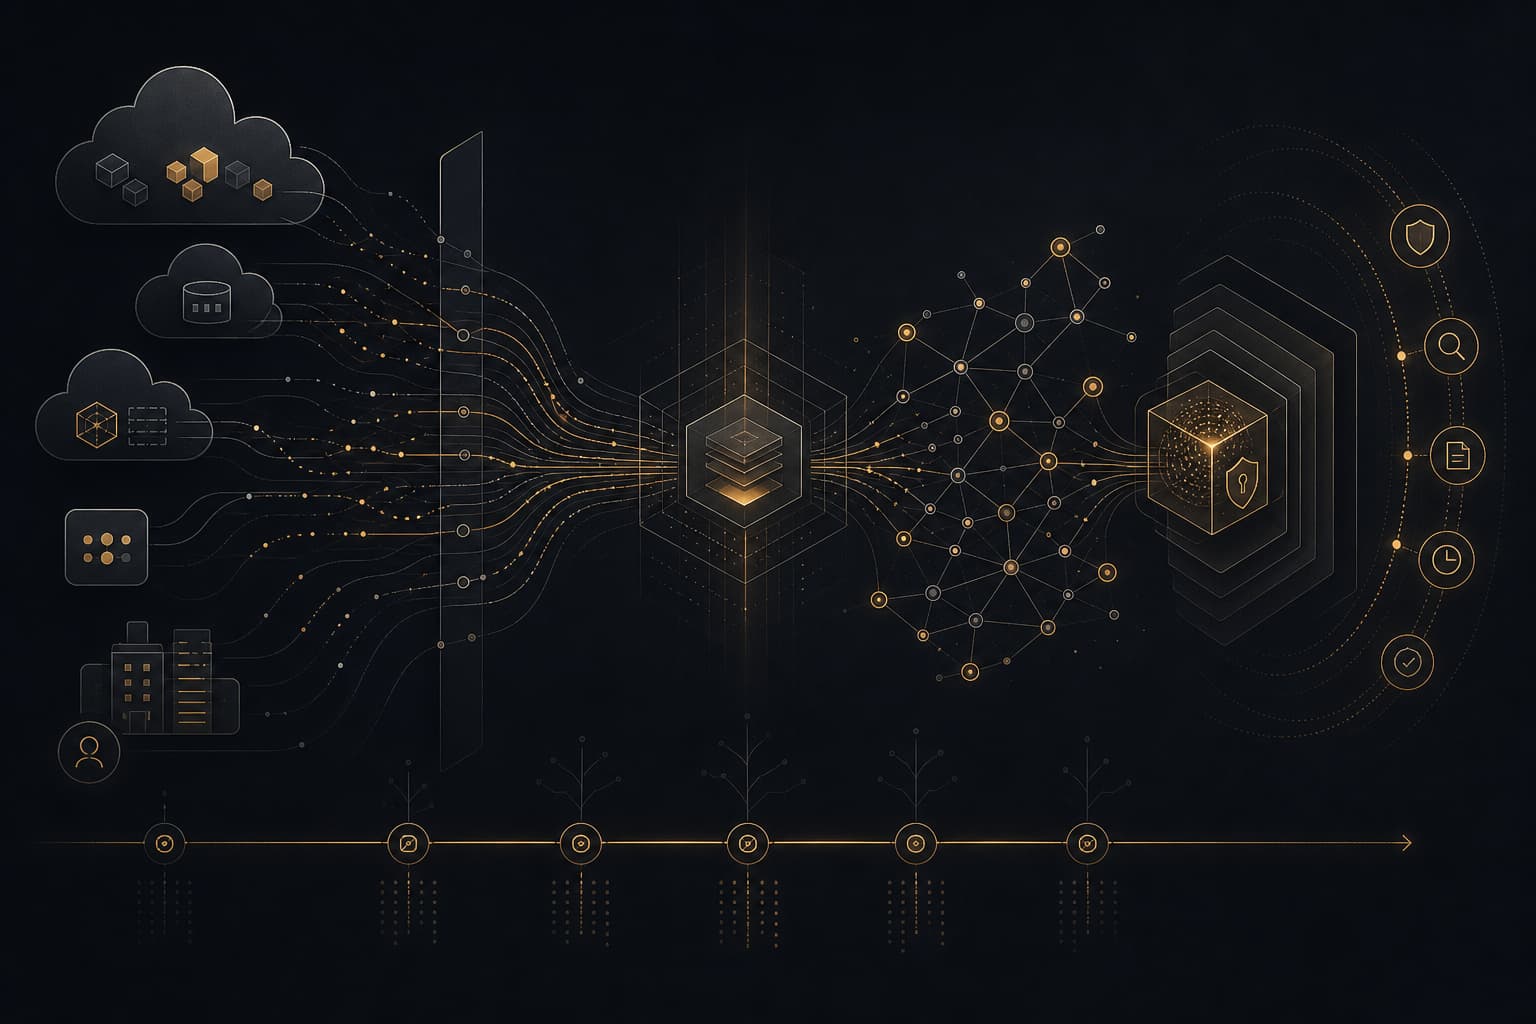
Atlassian engineers published a useful CNCF field note on 24 August 2026: root cause analysis in large cloud-native estates should be treated as a multi-signal correlation problem, not as a human hunt across disconnected dashboards. Their pattern combines metrics, logs, traces, time windows and service topology to generate ranked hypotheses, with evidence and a narrative a responder can validate.
For Luxembourg financial institutions, AIFMs, private banks and regulated FinTech platforms, the interesting part is not the algorithm alone. The strategic point is that operational resilience is moving from “we have monitoring” to “we can reconstruct causality, prove response discipline, and shorten business disruption.” That is exactly the direction DORA, CSSF incident reporting expectations and executive ICT accountability are pushing European technology leaders.
Regulatory & Business Impact
DORA has changed the board conversation around incidents. A major ICT event is no longer only an engineering failure; it can become a regulated reporting obligation, a client-impact event, a third-party risk issue and a management-body accountability question. CSSF guidance for DORA entities makes clear that the management body remains ultimately accountable for the ICT risk management framework, including governance, oversight and budget allocation. The ESAs’ first annual report on major ICT-related incidents also reinforces the systemic dimension of ICT risk across the EU financial sector.
That means “mean time to innocence” is not a serious operating model. During an incident affecting online trading, investor portals, payment flows, fund data distribution or risk platforms, leadership needs to know three things quickly: what user or client journey is degraded, which service or dependency is the most likely origin, and what evidence supports the mitigation decision. A generic AI chatbot over logs does not solve this. A proper RCA platform must bind telemetry, topology, change records and human decisions into one incident record.
The CNCF/Atlassian article is useful because it gives executives a practical language for this shift. Automated RCA is framed as correlation across signal type, time and topology. That maps well to DORA-style resilience because it produces a defensible incident trail: what changed, where the symptoms appeared, which upstream dependency was implicated, which team was paged, what mitigation was selected, and whether the hypothesis was accepted or rejected by responders.
There is also a cost argument. Many banks and fund service providers have accumulated observability spend without reducing incident friction. They own Prometheus, Grafana, ELK/OpenSearch, traces, APM and ticketing — but the on-call engineer still acts as the correlation engine at 02:00. The ROI is not another dashboard. It is reducing cognitive load, reducing escalation time, avoiding unnecessary vendor bridges, and giving audit, risk and operations one consistent view of the incident.
Architectural & Operational Blueprint
The architecture starts with boring discipline: consistent telemetry. OpenTelemetry is the right foundation because it standardises traces, metrics and logs across services and gives platform teams a real dependency graph from production traffic, not from stale diagrams. In regulated environments, that graph should be treated as a control asset. It tells you which services call each other, which APIs support critical business processes, and where a fault can propagate.
A credible RCA pipeline should contain five layers.
First, define service criticality. Not every pod is equal. Map investor onboarding, order execution, NAV delivery, AML workflows, payment initiation, reporting and client authentication to underlying services. This is where IT, risk and business operations must agree on what “critical” means.
Second, normalise telemetry into incident-ready events. RED metrics — rate, errors and duration — should be collected per endpoint. Logs should be structured enough for clustering and deduplication. Traces should include service names, span relationships and correlation IDs. Reverse proxies and traffic gateways such as F5, NGINX, Envoy or HAProxy must emit useful edge telemetry, because many incidents first appear as latency, 5xx spikes or authentication failures at the boundary.
Third, build the topology graph. In Kubernetes estates, OpenTelemetry-derived service maps can show real call paths. In hybrid environments, this must extend to VMware or Proxmox virtual machines, databases, message brokers, storage, firewalls, API gateways and third-party services. A Luxembourg fund platform rarely fails inside Kubernetes alone. It may fail because a batch dependency, DNS path, proxy rule, certificate, SFTP integration or market data feed became unhealthy.
Fourth, rank hypotheses rather than pretending to know the answer. The Atlassian pattern is strong because it does not replace the engineer with blind automation. It produces suspected root cause services, propagation paths, evidence at each node, confidence scoring and a readable explanation. In practice, this should open an incident in Jira, ServiceNow, Opsgenie or PagerDuty with links to the exact Grafana panels, trace IDs, log clusters and recent deployments.
Fifth, use AI only inside guardrails. An incident copilot can summarise evidence, suggest rollback options, draft stakeholder updates and query approved telemetry tools. But in a regulated environment it should not execute remediation without explicit approval. LangGraph-style workflows, private inference with vLLM or Ollama, and retrieval over an internal Qdrant knowledge base can be useful — if tool permissions, prompt logging, data classification and approval gates are designed from the beginning.
The operational pattern is straightforward: detect user impact, scope the affected service graph, collect anomalies across metrics/logs/traces, correlate them in time, walk upstream through dependencies, generate hypotheses, let responders validate, then preserve the evidence and decision trail. That is AIOps with engineering discipline, not theatre.
What This Changes in Practice
- Stop measuring observability by dashboard count. Measure whether telemetry can explain a client-impacting incident quickly and defensibly.
- Make service topology a governed asset. Keep dependency maps current and connect them to critical business services.
- Correlate signals before involving humans. Metrics, logs, traces, deployment events, feature flags and synthetic checks should arrive as one incident context.
- Keep humans in the approval loop. Automated diagnosis is valuable; unapproved automated remediation in finance is a control failure waiting to happen.
- Design for audit evidence. Preserve hypotheses, evidence, responder decisions, timestamps and communications for DORA and internal risk review.
- Treat third parties as graph nodes. Cloud services, SaaS platforms, payment providers, market data feeds and ICT subcontractors must be visible in the incident model.
- Run post-incident feedback loops. Capture whether RCA hypotheses were right, then tune detection thresholds, topology weighting and runbooks.
How Ali Run AIOps Approaches This
Ali Run AIOps approaches this from the infrastructure layer upward. The work starts with resilient Linux, virtualization and Kubernetes foundations; proper reverse-proxy and network telemetry; Grafana/Zabbix/OpenTelemetry observability; and Ansible automation that makes recovery repeatable. Once the operational data is trustworthy, AI can be introduced as a controlled accelerator rather than a risky black box.
For Luxembourg and European financial teams, the target architecture is a sovereign incident intelligence layer: private telemetry, private knowledge retrieval, governed AI assistance, and clear human approval gates. Whether the estate runs on VMware, Proxmox, bare metal, cloud or hybrid Kubernetes, the goal is the same: reduce outage duration, preserve evidence, control cost, and give management a resilience story that stands up in front of auditors and clients.
Sources
Related Notes
AIOps & Automation · Sep 1, 2026
OpenTelemetry Go logs near stable evidence layer
Go log telemetry is nearing v1 stability. For DORA-era finance, standardise incident evidence before audits force the issue.
Cloud & Virtualization · Aug 27, 2026
Kubernetes 1.37 makes AI clusters auditable
Kubernetes 1.37 turns AI clusters into resilience evidence: scheduling, metrics, identity and upgrade hygiene now matter.